- Jeliazkova, N., Jeliazkov V.,Chemical Landscape Analysis with the Opentox Framework, Current Topics in Medicinal Chemistry, 2012, 12(18);1987-2001(15). Discussions at this Google Plus post
- Jeliazkova, N., Kochev N., Jeliazkov V., Chemical Landscape Analysis - the case of tautomers - poster at the 6th Joint Sheffield Conference on Chemoinformatics, July 2013 Discussions at this Google Plus post
The SAR landscape and activity cliffs concepts have their origins in medicinal chemistry
and receptor-ligand interactions modelling.
Activity landscape
A representation that integrates the analyses of the structural similarity of and potency differences between compounds sharing the same biological activity
Activity cliff
A pair of structurally “similar” compounds with “large” differences in potency.This is an intuitive concept for a medicinal chemist, and corresponds to the exceptions of the “similarity principle” or neighbourhood behaviour, assuming that similar structures have similar properties.
SAR analysis
The characterization of activity landscapes is performed by visual exploration with the help of SAS maps, network graphs, or by quantifying the relationship between the chemical similarity and activity similarity. The activity similarity is usually defined by absolute differences between activities, or absolute differences, normalized by the activity range: SAR Index ,SALI index.While it has been argued that the activity cliff concept is not applicable to properties beyond receptor interaction , the techniques of detecting discontinuities in SAR landscapes are potentially useful in modelling any chemical property, even though the reason for the cliffs existence may be different.
ToxMatch 1.x
The authors’ interest in exploring the similarity concept emerged while preparing a review on the approaches to measure similarity and, later, with the development and maintenance of the open source ToxMatch 1.x software [doi:10.1016/j.yrtph.2008.05.012], which encodes a variety of chemical similarity indices and facilitates visual exploration of structure and activity similarities in datasets.The similarity paradox
Fundamental in both the review and the software is the understanding that similarity is not an absolute concept and that the “similarity paradoxes” should not be ignored, but rather should be studied in greatest detail. ToxMatch 1.x is an implementation of a tailored similarity space – in essence, requiring a training set and supervised machine learning algorithms in order to apply similarity measures for property prediction. In the years following ToxMatch 1.x development, it became widely recognized that the “neighbourhood behaviour“, although a useful hypothesis, is not valid everywhere in the chemical space. The multitude of approaches to characterize activity landscapes, exemplify that this is now a mainstream knowledge, but unambiguous characterization of activity landscapes is an yet unsolved scientific problem.ToxMatch 2
ToxMatch 2 relies on a new and efficient method for identifying activity cliffs.- Reformulates the problem as a statistical one
- Introduces a probabilistic measure, namely, calculating the likelihood of a compound having large activity difference compared to other compounds, while being highly similar to them.
- Calculating the likelihood relies on four counts only, and does not require the pairwise matrix storage.
- Generates a list of individual compounds, ranked according to the likelihood of their involvement in the formation of activity cliffs
- Goes beyond characterizing cliffs by structure pairs only
- Requires explicitly setting similarity and activity difference thresholds, but provides means to explore multiple thresholds and to visualize in a single map how the thresholds affect the activity cliff identification.
Implementation
Finally, the method is implemented as part of an existing open source Ambit package and could be accessed via an OpenTox API compliant web service and via an interactive application, running within a modern, JavaScript enabled web browser. Combined with the functionalities already offered by the OpenTox framework, like data sharing and remote calculations, it could be a useful tool for exploring chemical landscapes online.
We have recently proposed a new and efficient method for identifying activity cliffs and visualization of activity landscapes [1].
The method ranks the activity cliffs by a probabilistic measure - the likelihood of a compound having large activity difference compared to other compounds, while being highly similar to them.
The `G^2` statistics [2,3] estimates the likelihood of an event `t` taking place when another event `s` is also observed. The 2x2 contingency table (Table 1) defines the conditional probabilities of the event `t`, provided that the event `s` or its opposite (`!s`) was observed.
Note that this is a ranking of individual structures, not pairs of structures.
This is a significant advantage, especially when processing large datasets,
as only the likelihood (or the four counts) need to be stored per compound,
instead of the entire pairwise matrix.
The column `a` gives the number of pairs that form activity cliffs with the compound.
The paired structures can be easily retrieved by a standard similarity query.
The arrangement as a graph naturally emerges from the set of top ranked compounds, as they are usually interconnected as activity cliffs pairs.
The method goes beyond finding structure pairs only.
| Events | `s` (high similarity) | `!s` ( low similarity) |
|---|---|---|
| `t` (large activity difference) | `a ~ P(s|t)` | `b ~ P(!s|t)` |
| `!t` (small activity difference) | `c ~ P( s| !t)` | `d ~ P (!s | !t)` |
`G^2 = alog((a(c+d))/(c(a+b))) + blog((b(c+d))/(d(a+b))) `
The `G^2` statistics is used in natural language processing as a measure of words co-occurrence. In our case, `G^2` represents the likelihood of a compound forming an activity cliff, which is defined by a large difference in activity (event `t`) with other compounds in the dataset, given high similarity (event `s`). To calculate the activity cliff likelihood, one has to define what is considered a large difference in activity (i.e. an activity threshold), and what is considered a high similarity (i.e. a similarity threshold). Once the thresholds are defined, the 2x2 contingency table (Table 1) is prepared by comparing the compound with all other compounds in the analyzed dataset and incrementing the relevant count- `a` is the number of pairs with activity difference above the activity threshold and similarity above the similarity threshold
- `b` is the number of pairs with activity difference above the activity threshold and similarity below the similarity threshold
- `c` is the number of pairs with activity difference below the activity threshold and similarity above the similarity threshold
- `d` is the number of pairs with activity difference below the activity threshold and similarity below the similarity threshold)
| `G^2` rank | ID | `a` | `b` | `c` | `d` | Activity | `G^2` |
|---|---|---|---|---|---|---|---|
| 1 | 2 | 216 | 0 | 310 | 50 (inactive) | 32.34 | |
| 2 | 1 | 310 | 1 | 216 | 5.84 | 0.07 | |
| 3 | 1 | 308 | 1 | 218 | 10.90 | 0.07 |
The method goes beyond finding structure pairs only.
Browse the interactive ranking and visualisation
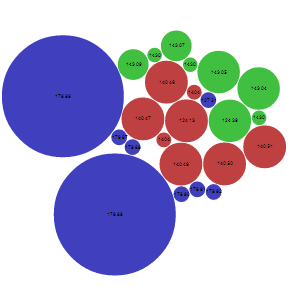 The circles area is proportional to `G^2`. The activity cliffs are as
in the Table 1. (Activity cliffs ranking tab).
The bubble chart is space efficient and can represent a large number of values in a small space.
The circles area is proportional to `G^2`. The activity cliffs are as
in the Table 1. (Activity cliffs ranking tab).
The bubble chart is space efficient and can represent a large number of values in a small space.
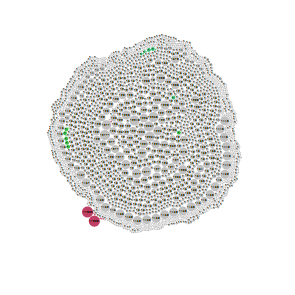

Inverted activity-similarity map of 756 Dihydrofolate Reductase Inhibitors (of P. carinii DHFR) with IC50
Generated from the Sutherland DHFR dataset DOI: 10.1021/ci034143r
- The code of these pages are at https://sourceforge.net/projects/toxmatch/
- The code of the activity cliffs ranking method is part of Ambit REST web services. Ambit modules are also available through the Maven repository.